ODYSSEY
Interactive Web-Based Data Visualization of the Space Age
︎︎︎Live Version: To Be Uploaded
PROJECT DESCRIPTION
As a member of Generation Z, Yutong was raised up in
a world with a long-existing obsession of space exploration. Seeing countless news on space
technology and launches of space missions, Yutong has always wondered the following questions:
What is the reason behind this obsession?
What is the origin of this obsession?
How has it marked the development of mankind?
These questions drove Yutong to research on the Space Age, an age of space explorations and technology starting from 1957. They have searched for data about significant events and space missions during the Space Age and created Odyssey, a web-based interactive data visualization.
Type
Date
Instructor
Keywords
Tools
Date
Instructor
Keywords
Tools
Individual Project
May 2021
Leon Eckert
Data Visualization + Interactive Website Design
JavaScript (d3.js) + HTML + CSS
May 2021
Leon Eckert
Data Visualization + Interactive Website Design
JavaScript (d3.js) + HTML + CSS
PROCESS OVERVIEW
︎ 01 Approach
︎ 02 Visual InspirationsIns
︎ 03 Design System
︎ 04 Outcome
01 APPROACH
Data Collection
The input data came from five datasets:
1. UCS Satellite Database
2. Chronology of Space Launches from Gunter's Space Page
3. Launch Sites from Gunter's Space Page
4. Chronology of Significant Events in Space from Wikipedia
5. GeoJSON Data for Countries in the World
The first two datasets were downloaded from the web as excel forms, which were converted by Yutong into csv and json files for using in my coding process. The third and fourth datasets were scraped from web pages in json files by Yutong using ParseHub, a web scraper. The last one was received from Prof. Leon Eckert as a class material.
Coding
This data visualization was coded in JavaScript with the use of d3.js library, HTML, and CSS:
 JavaScript: Programmed Interactions
 JavaScript: Programmed Interactions
CSS: Designed Website Layout
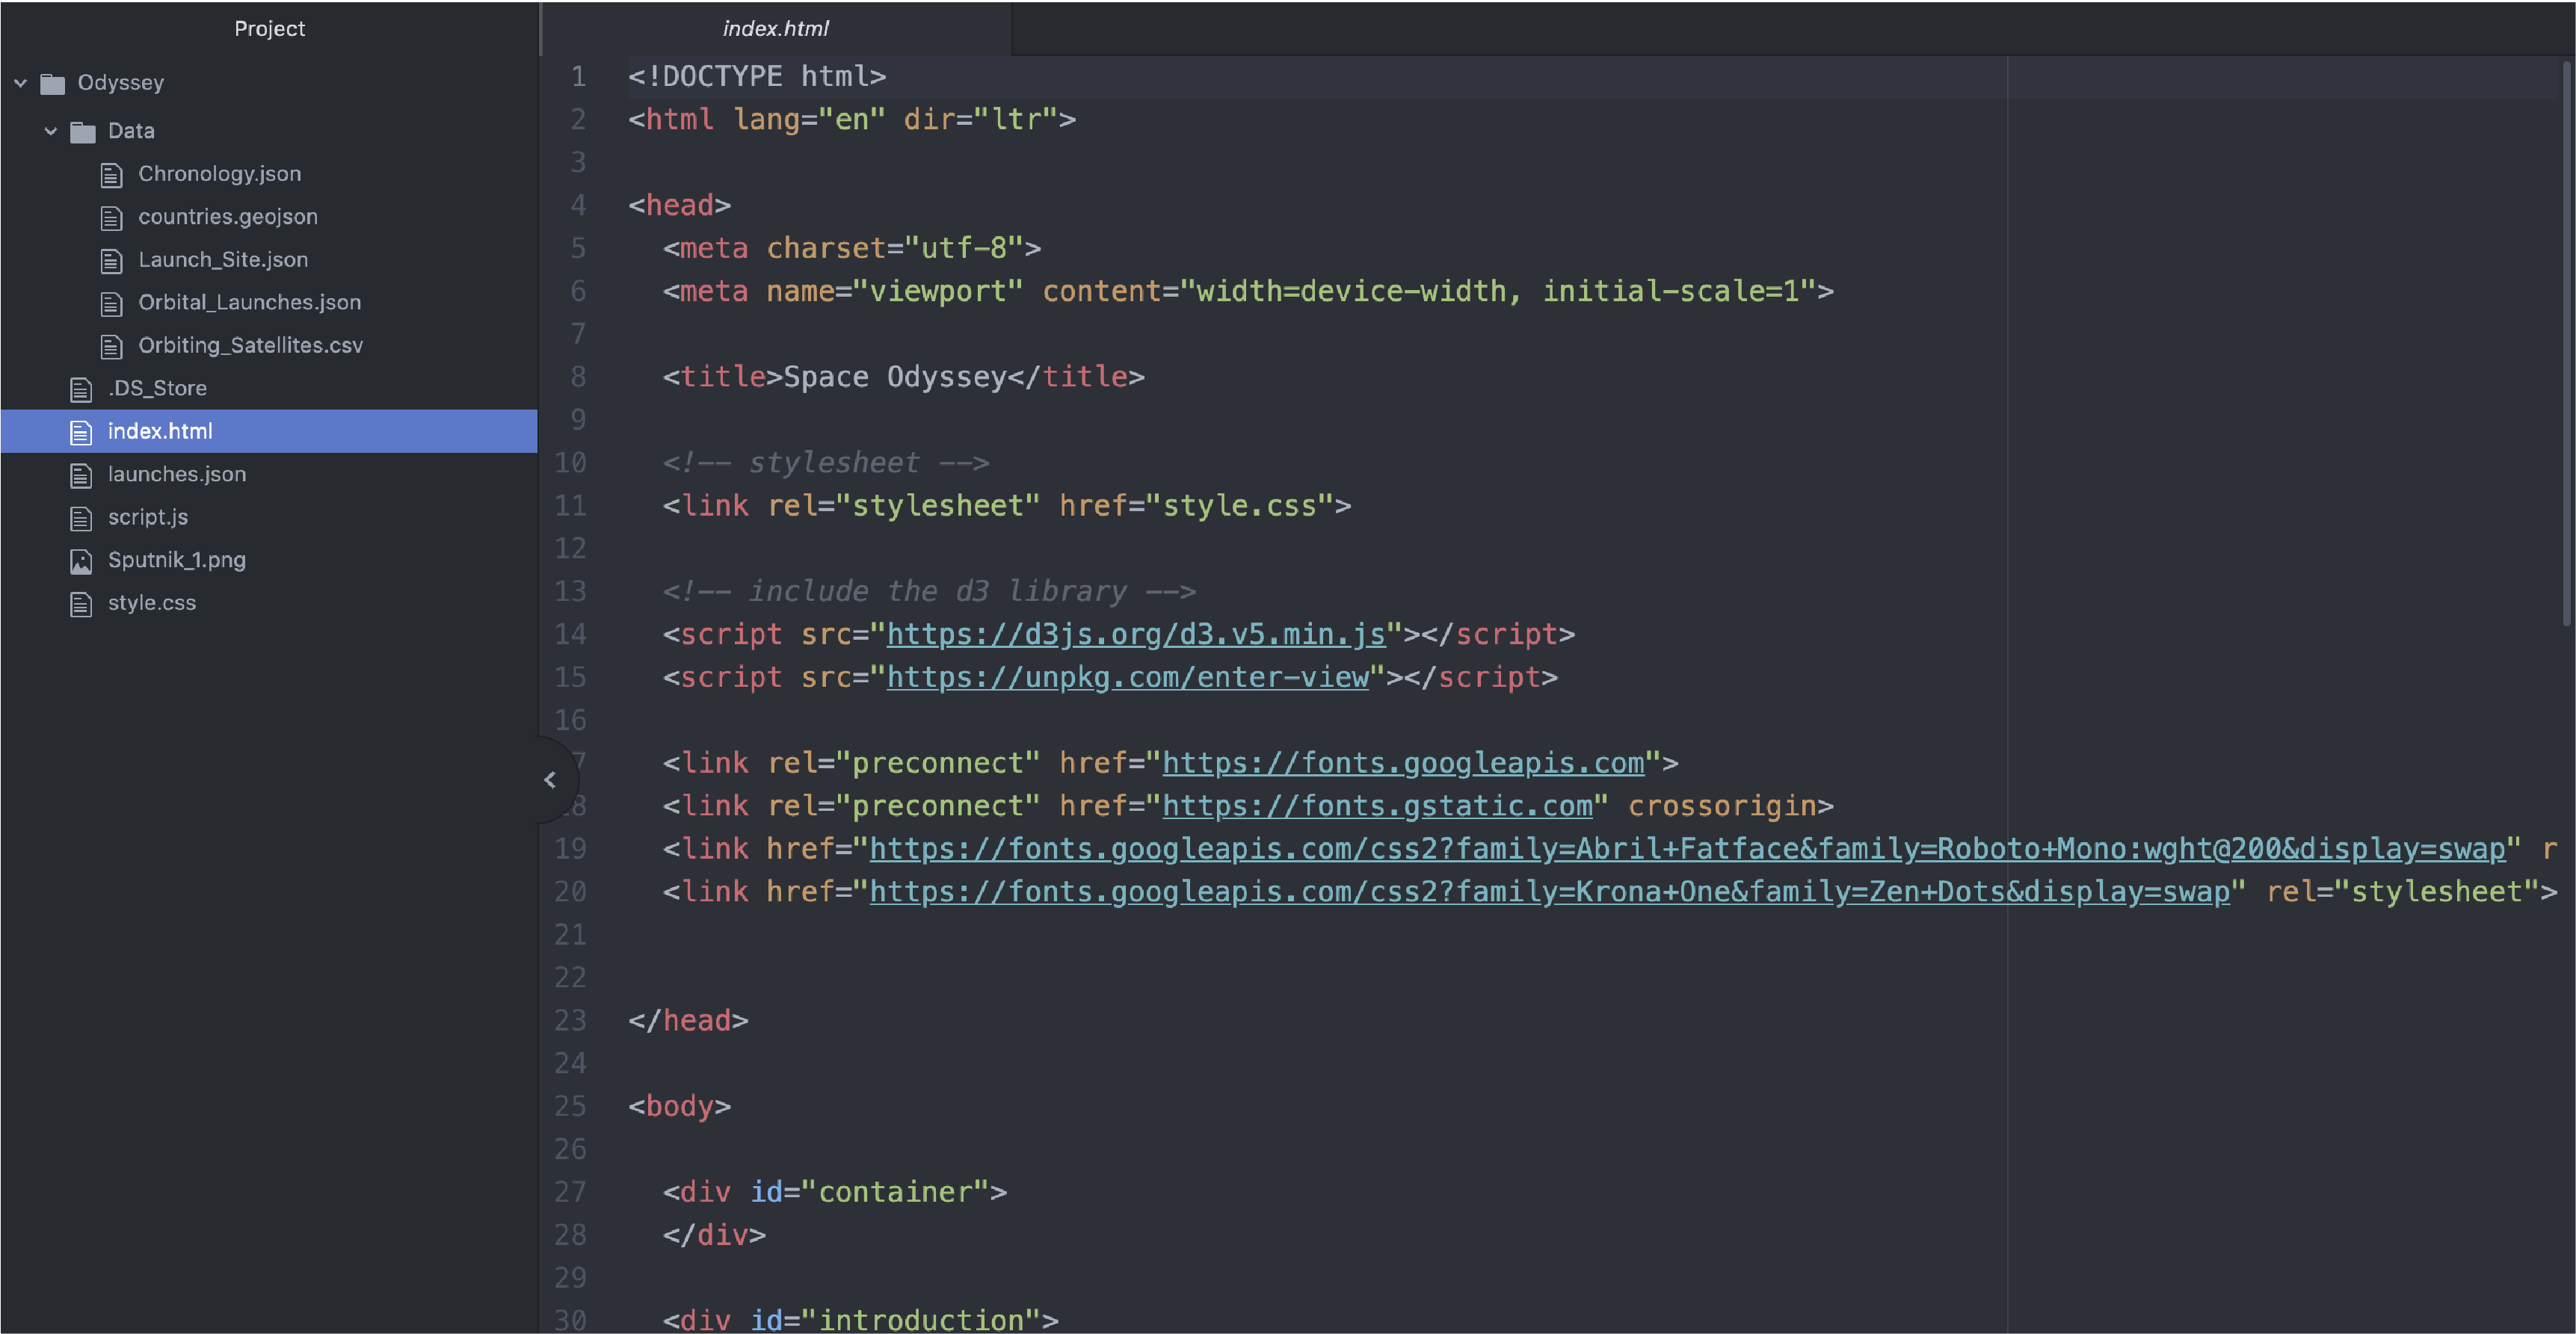 HTML: Coded Website Content
02 VISUAL INSPIRATIONS
For a clean and minimal style and informative design, the following cover arts and website were used as both style and color references:
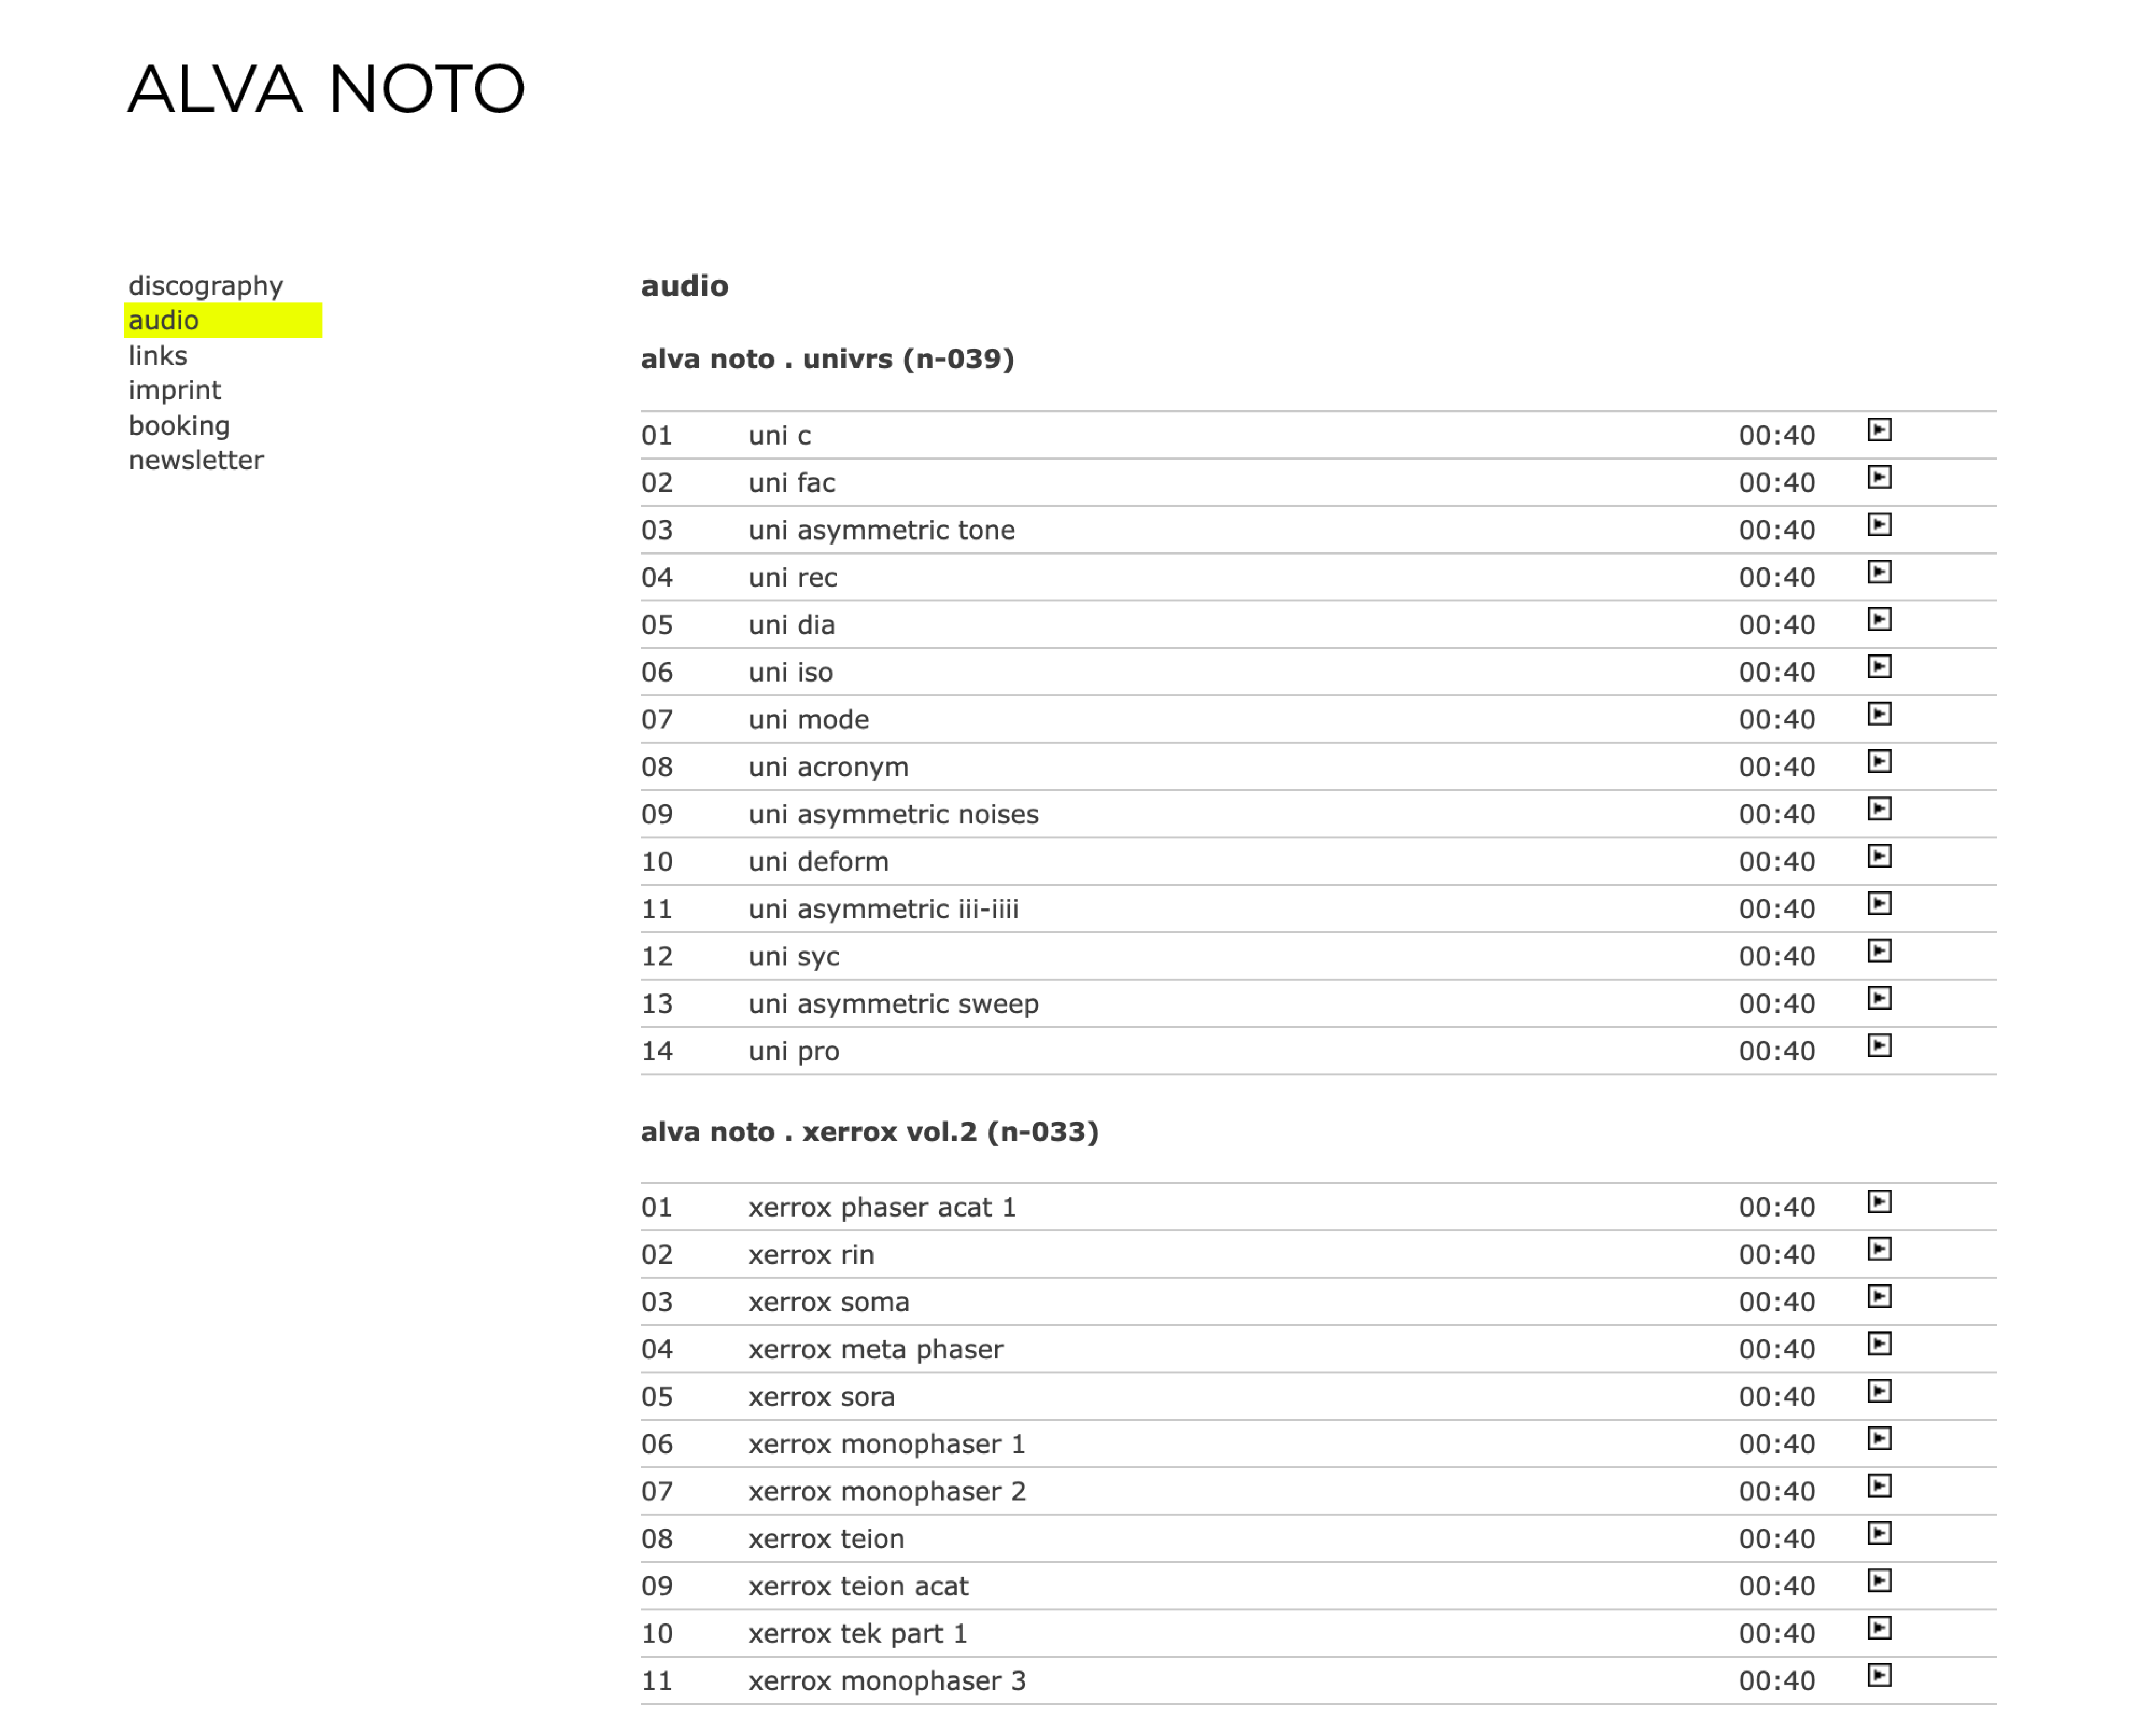
Alva Noto - alvanoto.com
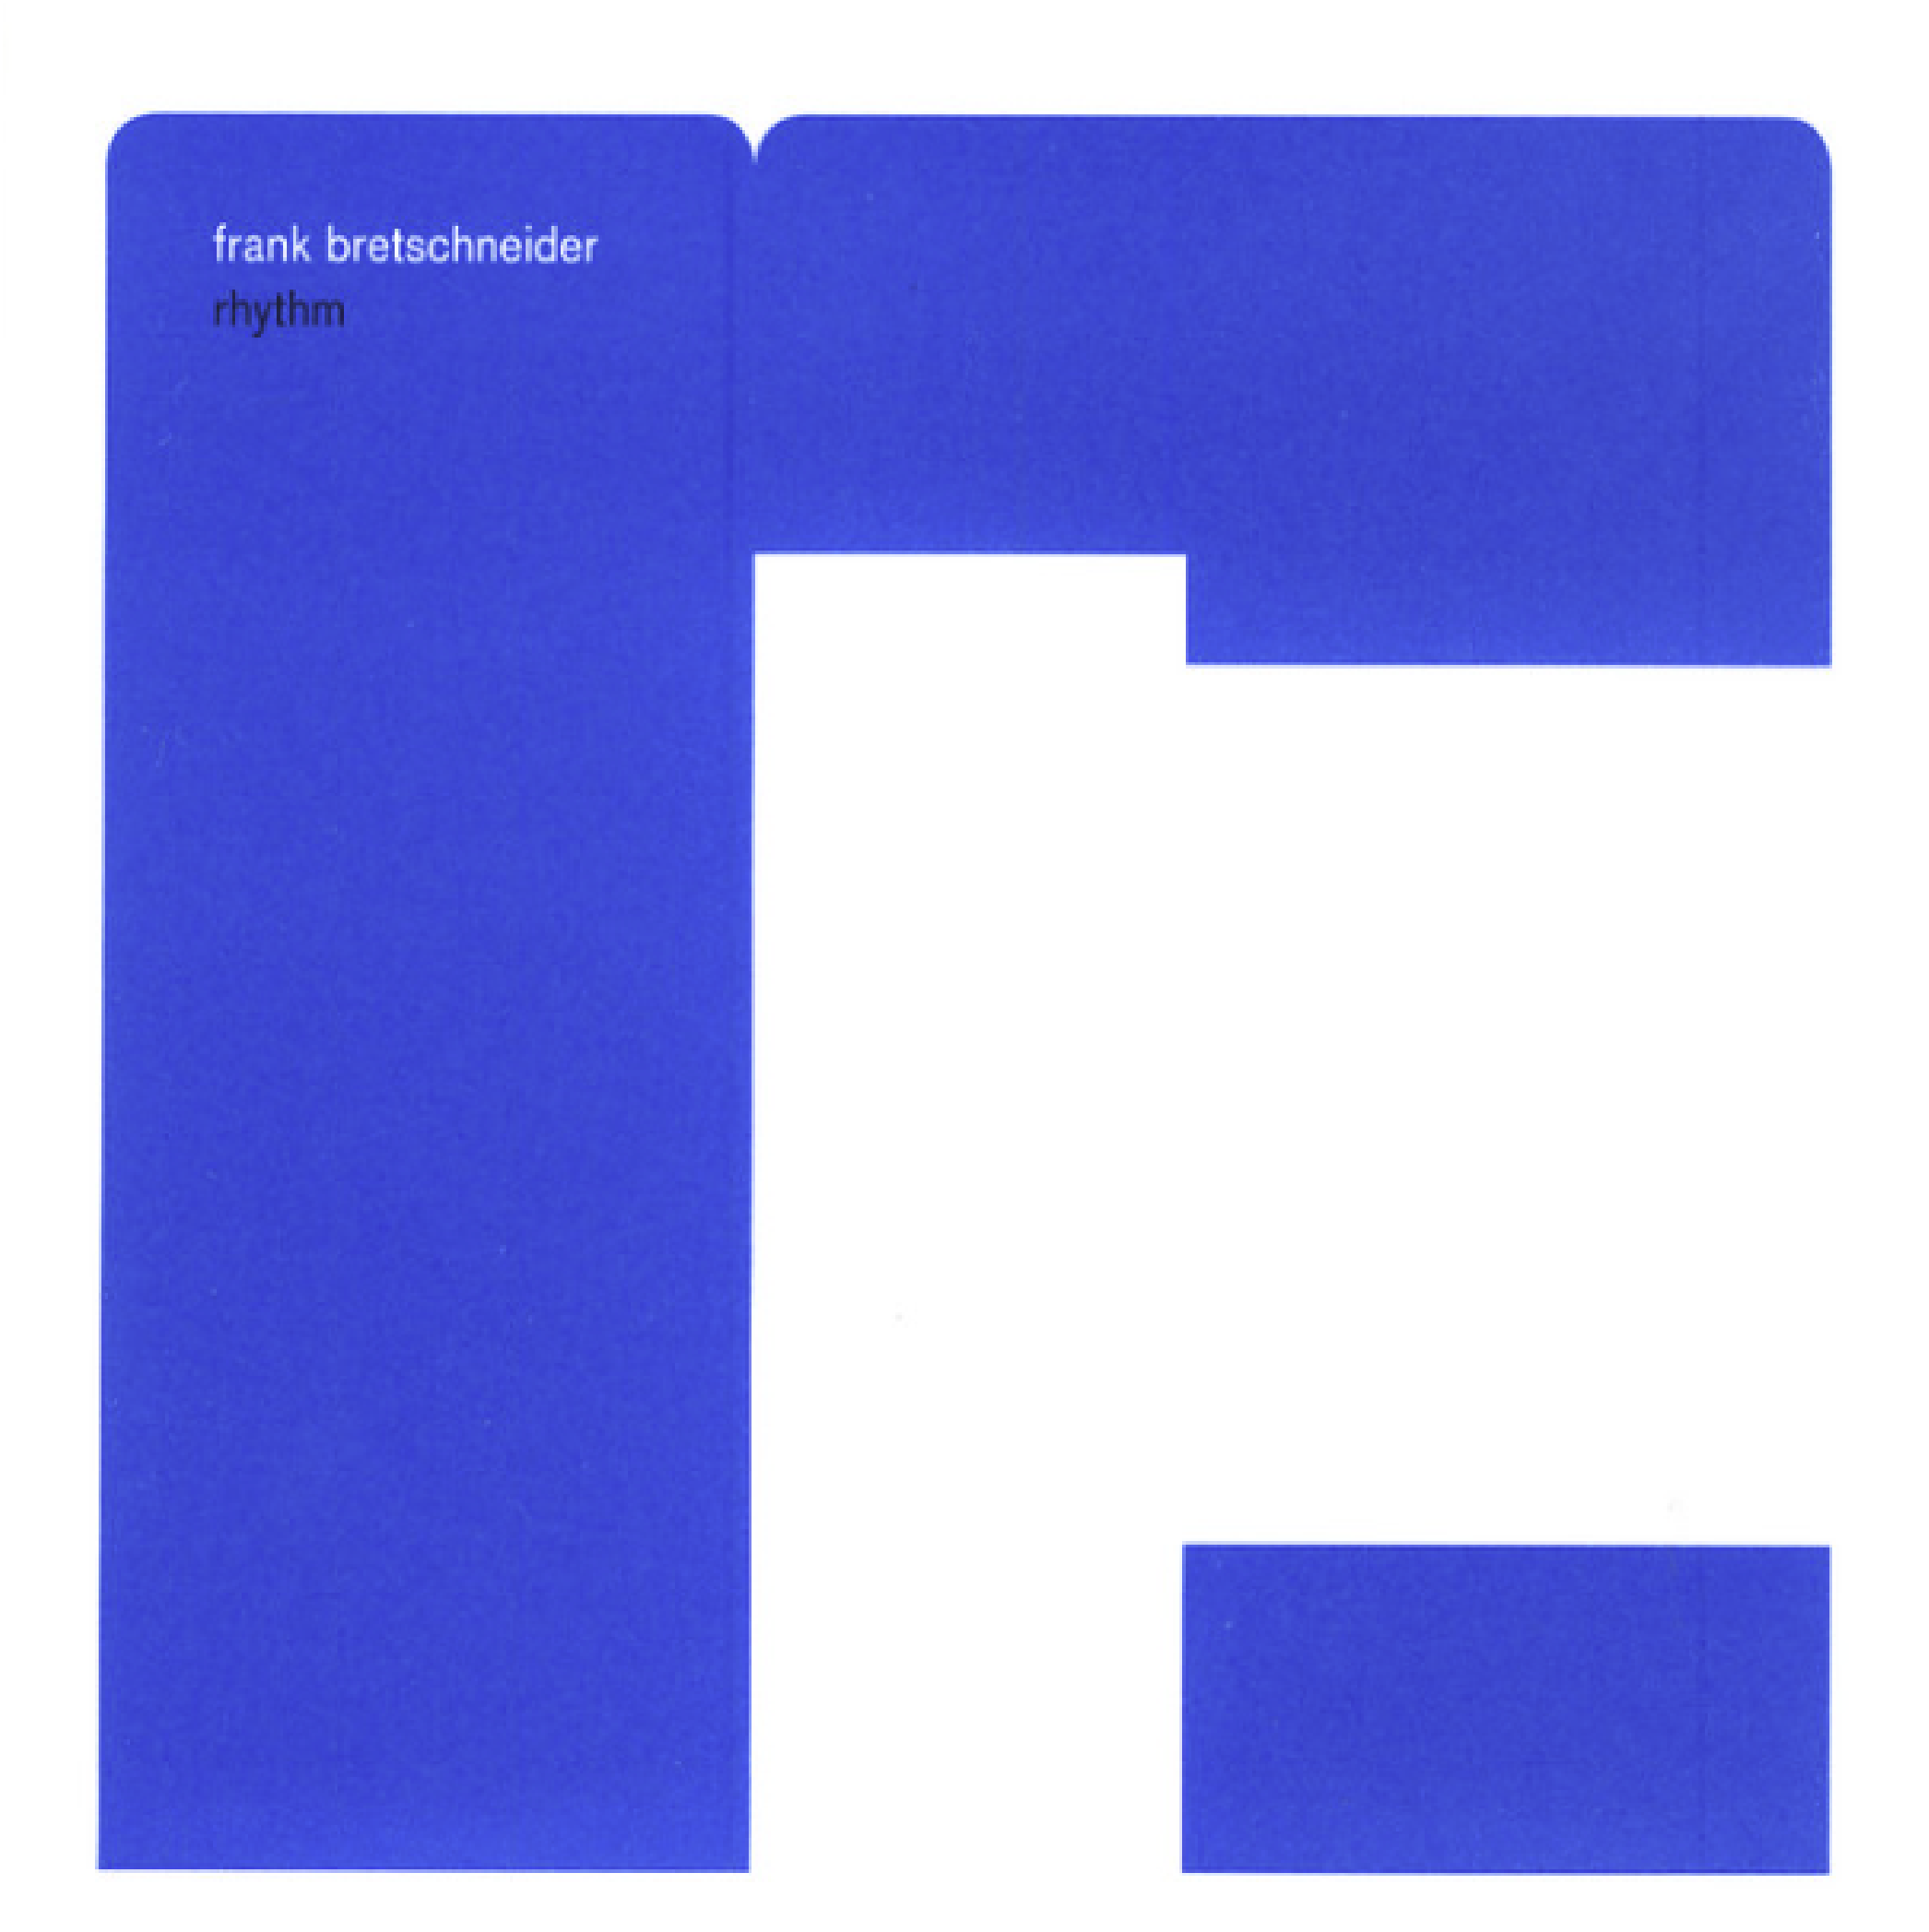 Frank Bretschneider - Rhythm
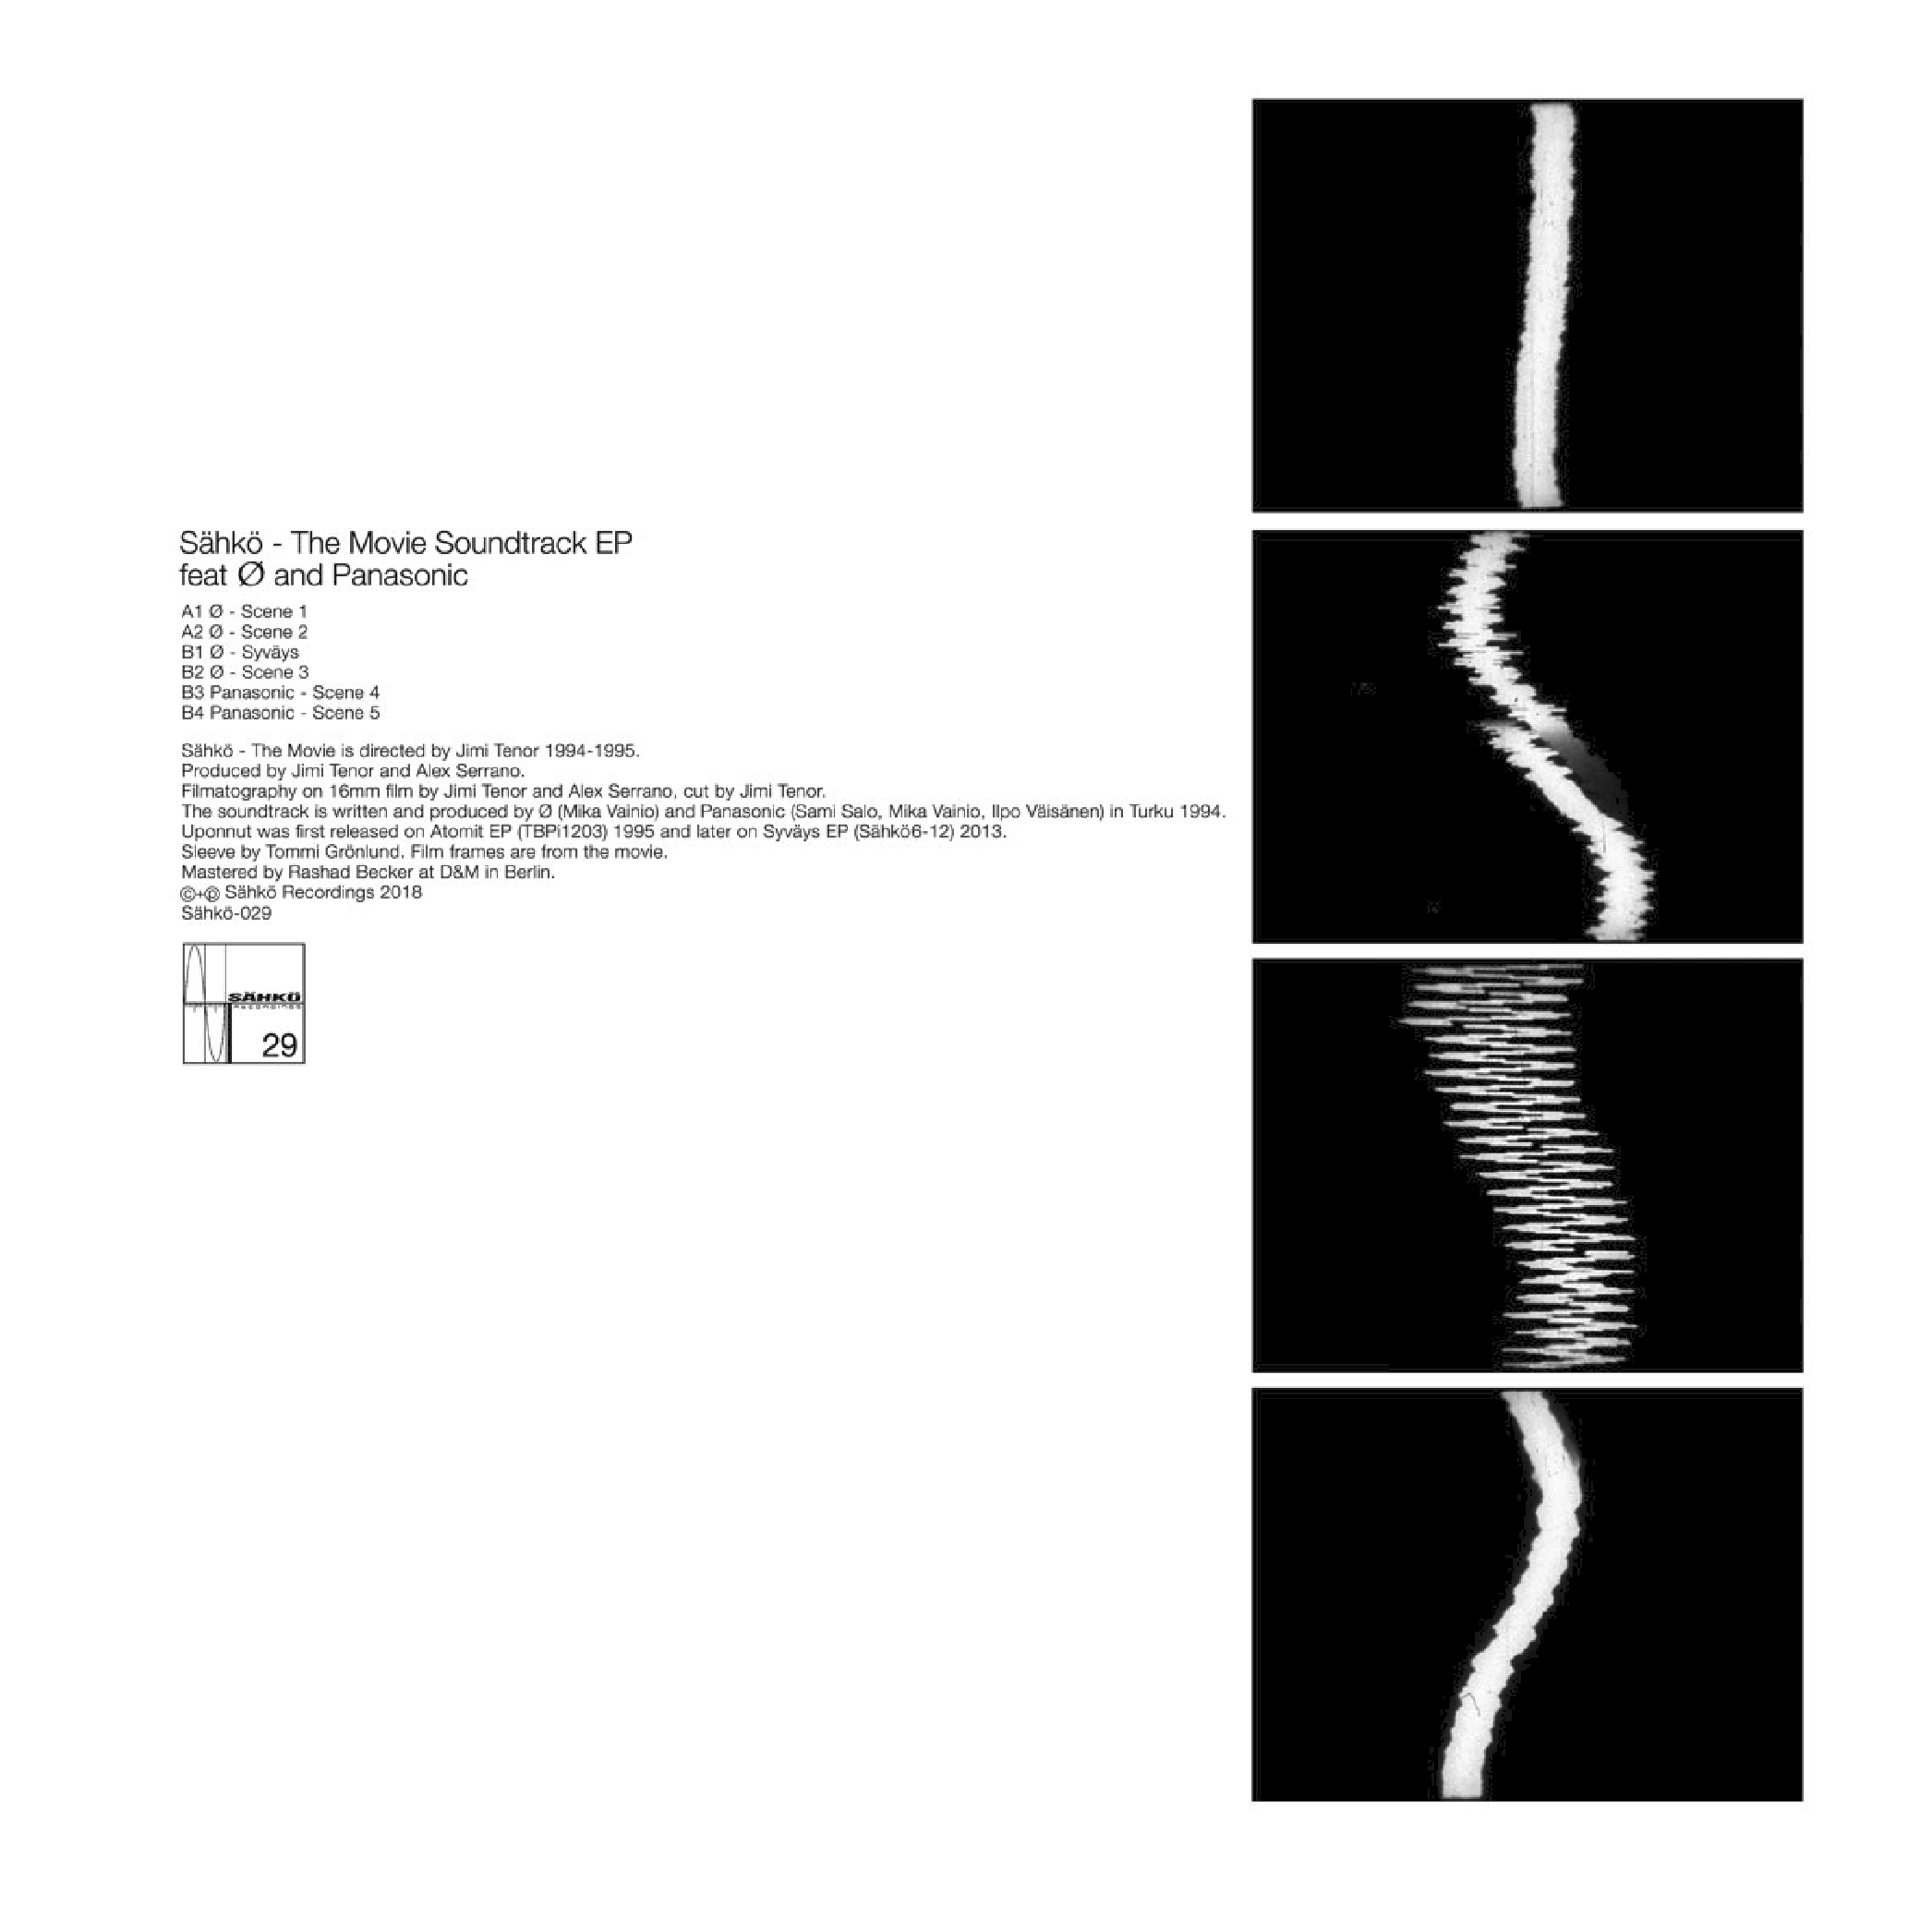 Ø & Panasonic -
 Sähkö - The Movie Soundtrack EP
03 DESIGN SYSTEM
Based on the references, a design system was created:
![]()

04 OUTCOME
The outcome is a eight-section interactive data visualization. These sections vertically aligned and users to need scroll down to view them all. In interactive sections, there are instructions for how to interact on the left.
Here are four selected sections:
 Introduction
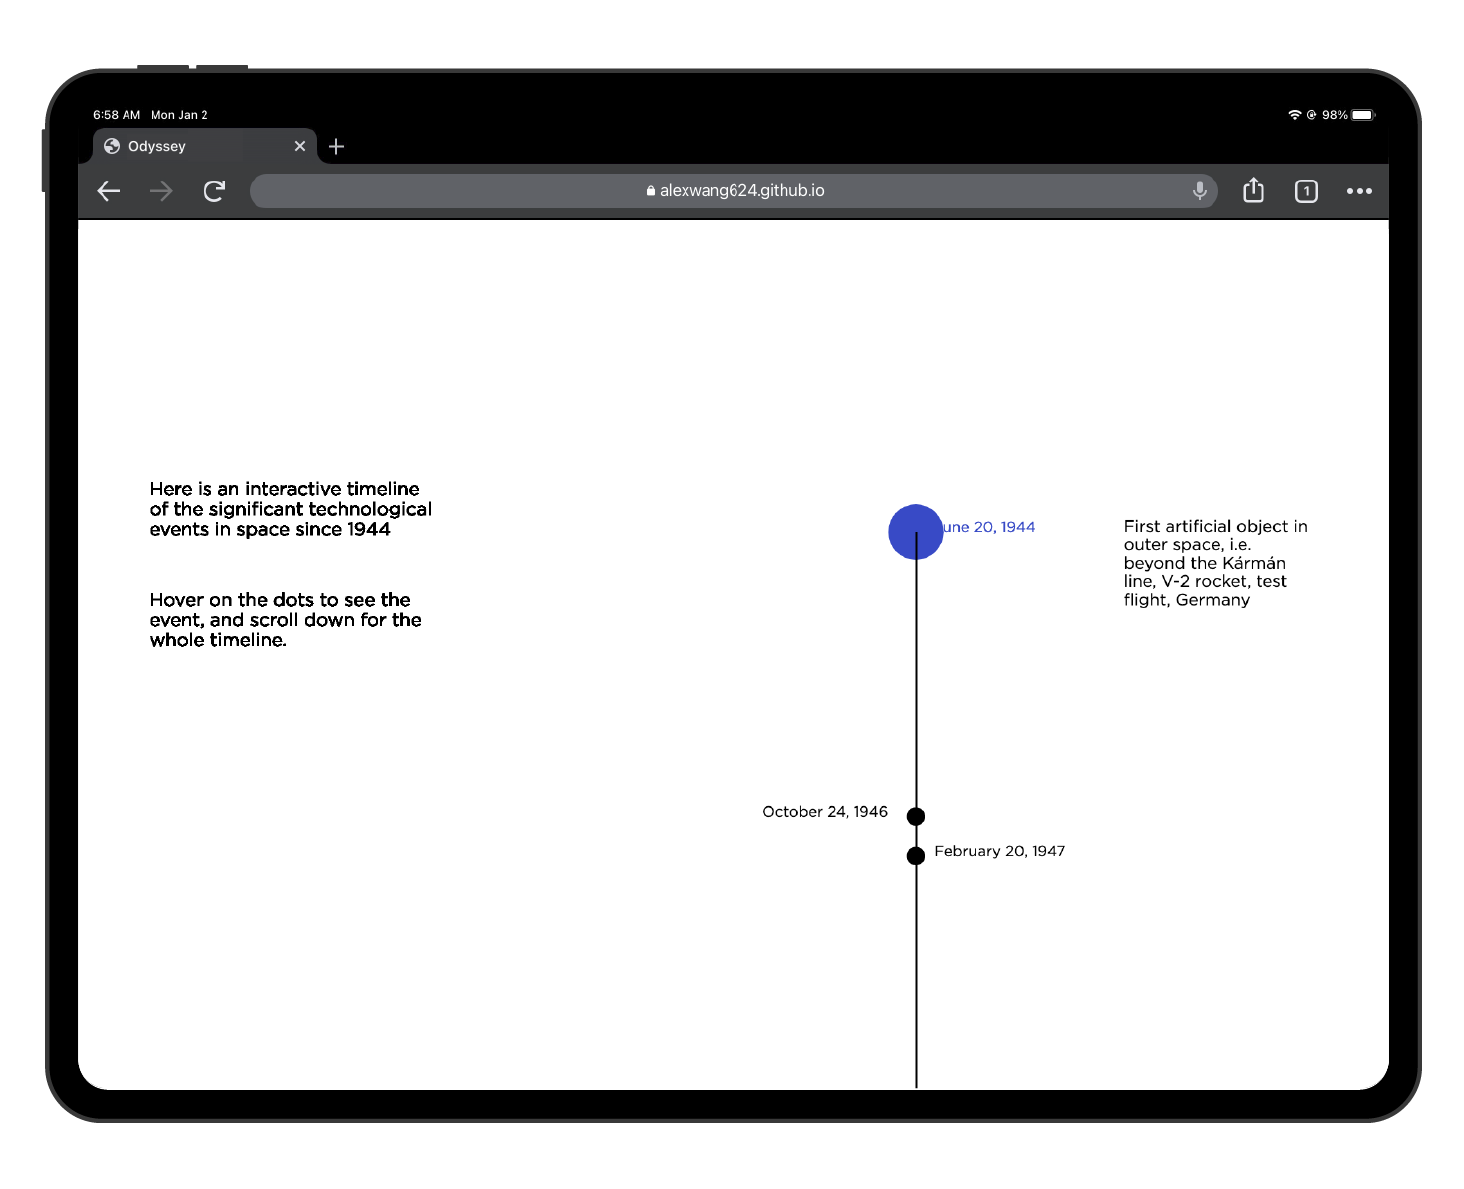 Scrollable Timeline of
Significant Technological Events
Scrollable Timeline of
Significant Technological Events
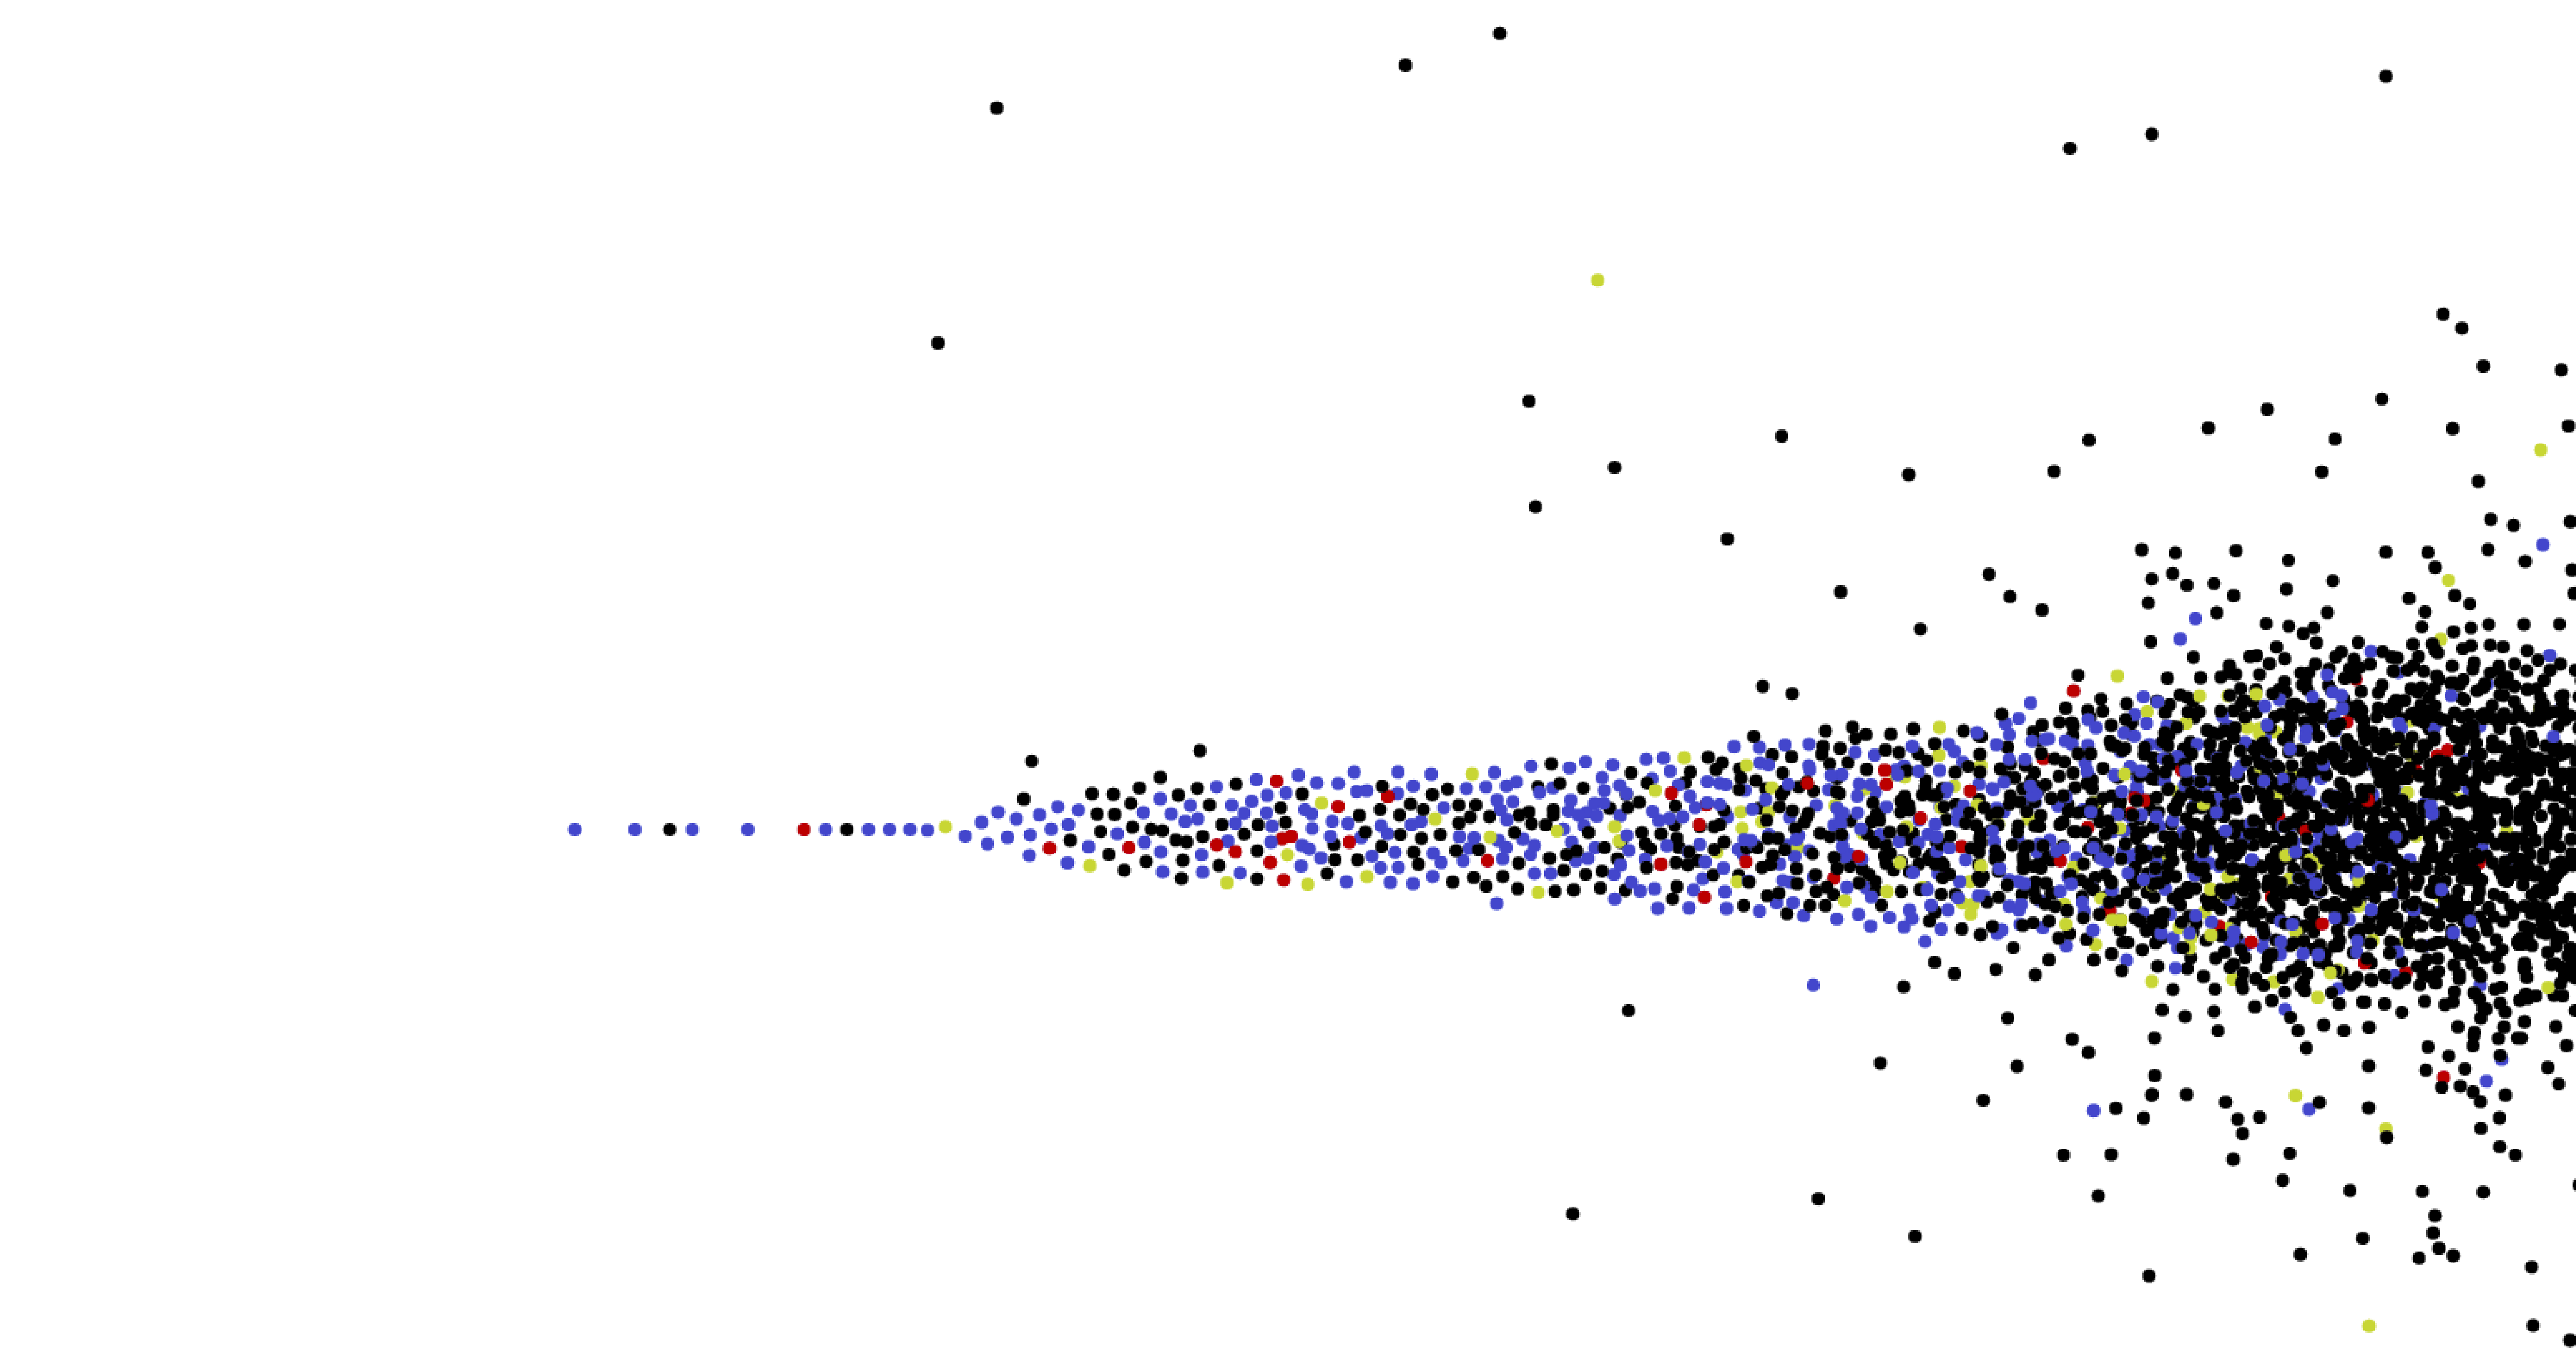
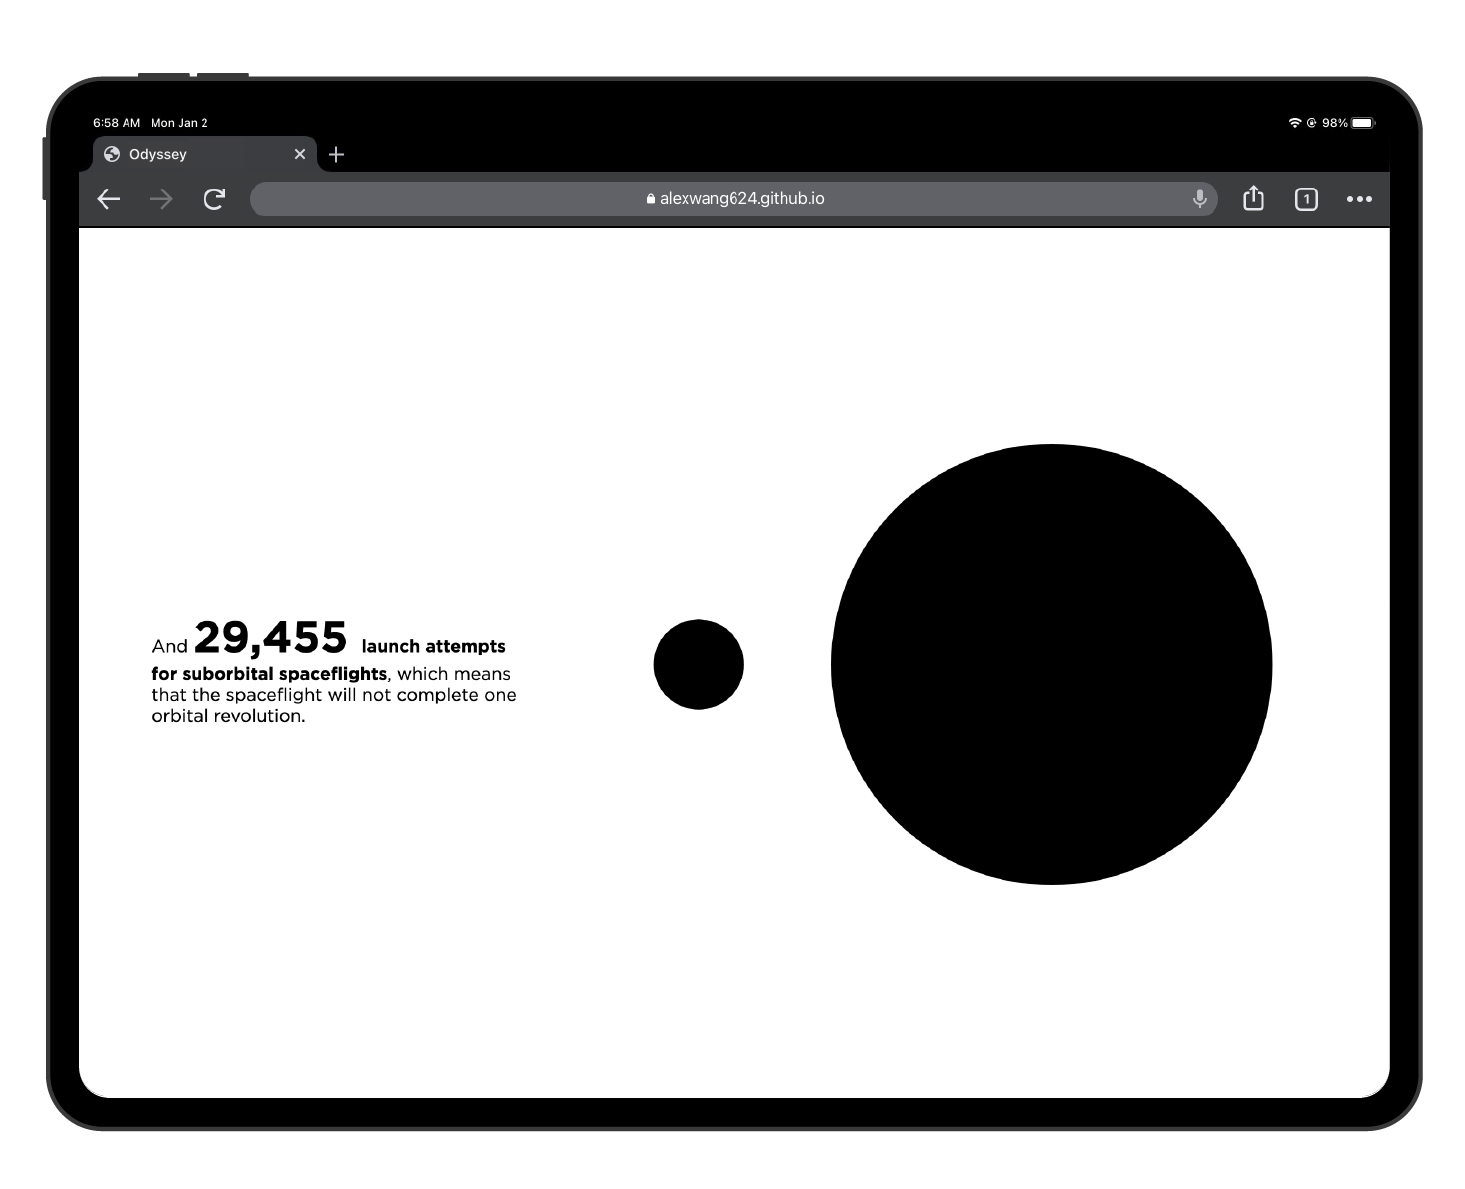 Scrollable Visualization of Orbital
and Suborbital Spaceflights
Scrollable Visualization of Orbital
and Suborbital Spaceflights
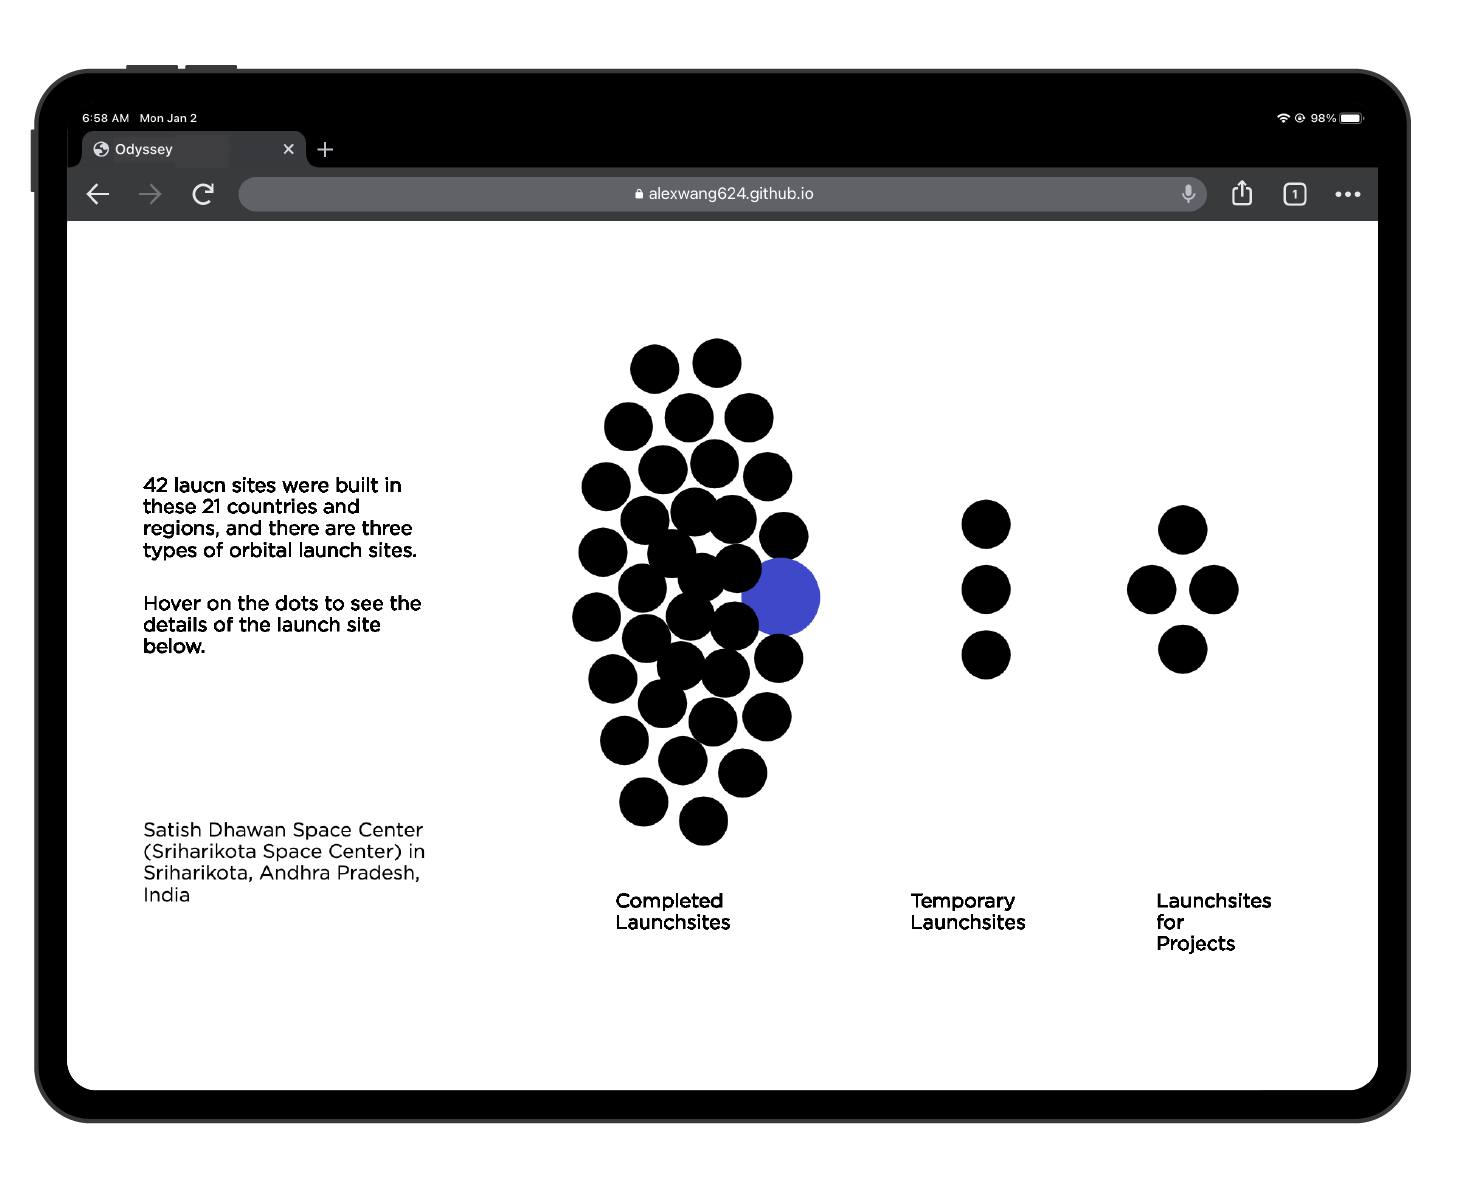 Force Graph of Orbital Launch Sites
 Bar Chart of Orbital Launches Per Year
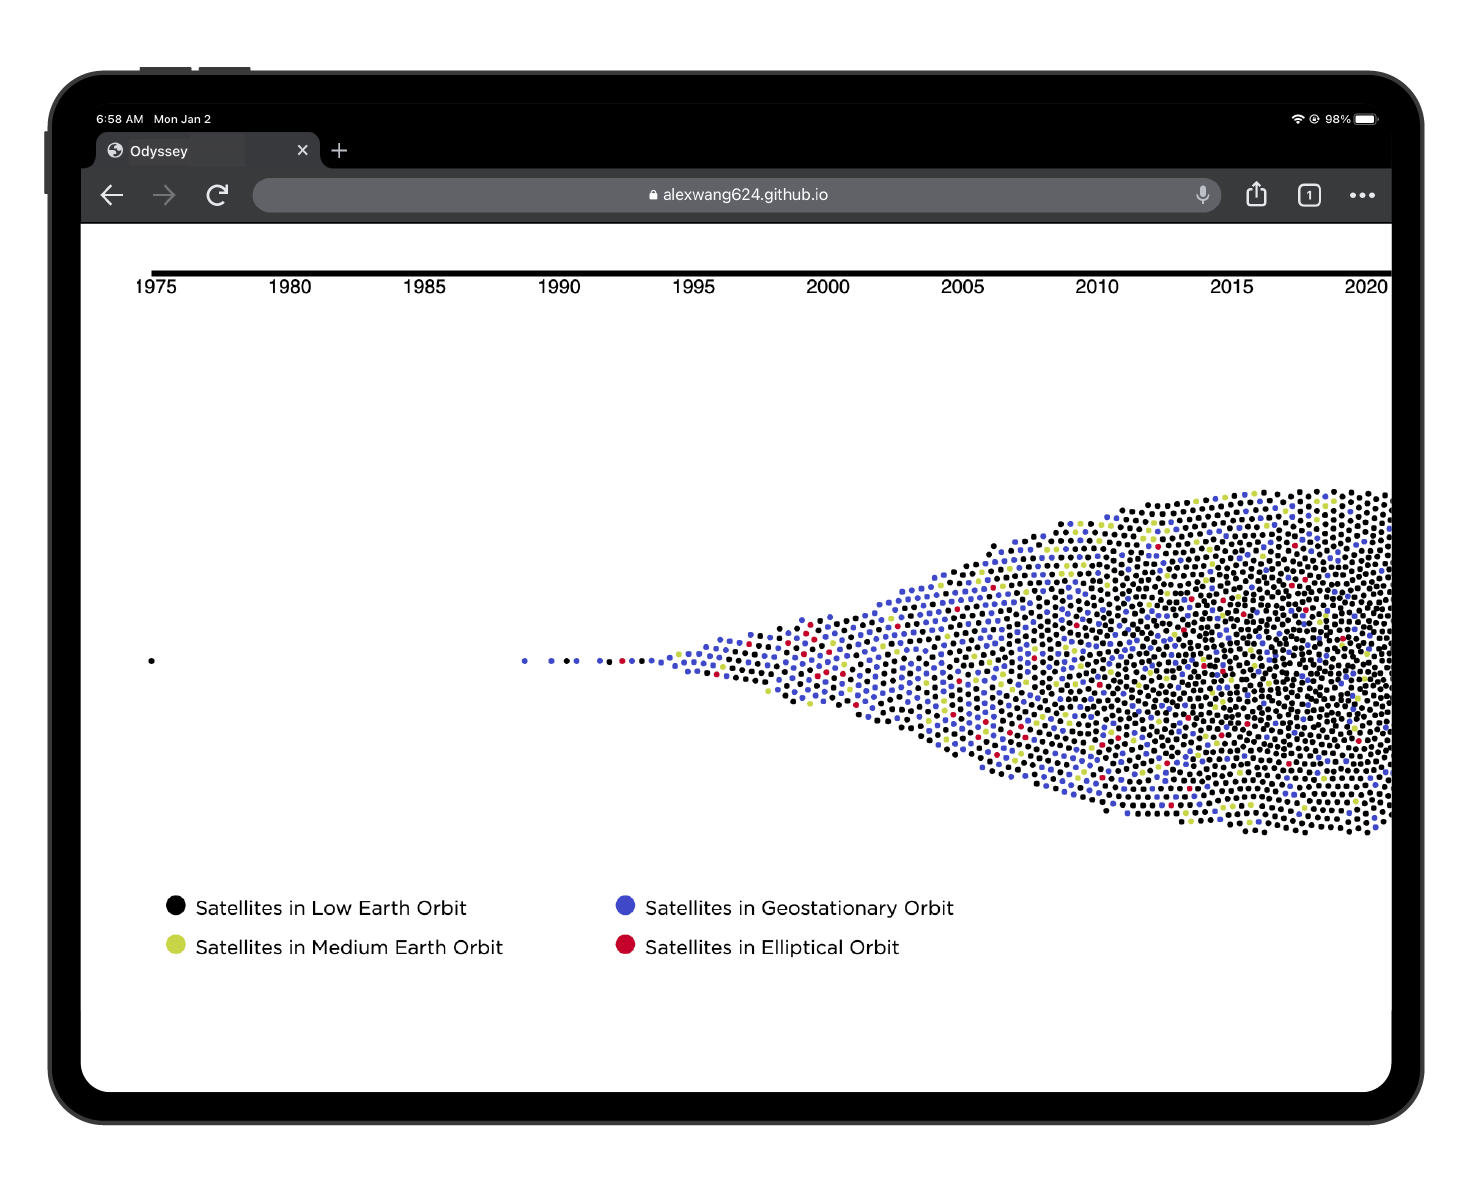 Force Graph of Operational Satellites